Gurinder Singh
Ghuman
Data & Automation · Operations Analytics · Full-Stack Tooling
Data and automation professional with an MSc in Data Analytics & Marketing. Translating operational complexity into measurable KPIs, repeatable reports, and lightweight automation — with the strategic mindset of a commissioned Military Officer.

About Me
Data Professional &
Former Military Officer
Data and automation professional with an MSc in Data Analytics & Marketing. Expert in translating operational pain points into measurable KPIs, repeatable reports, and lightweight automation tools that stick.
My background as a commissioned Military Officer in the Indian Army shaped my ability to lead under pressure, coordinate across diverse teams, and deliver strategic outcomes — qualities I now bring to every data project and full-stack build.
Experience & Education
Marketing & Business Intelligence Intern
Developed recurring BI reports and dashboards for stakeholder decision-making. Structured and validated complex datasets; supported campaign performance tracking for email marketing.
Military Officer – Operations / Intelligence / GIS
Provided critical operational decision support in high-pressure environments. Designed and maintained a strategic GIS database; coordinated across diverse teams for strategic objectives.
🏅 Army Commander's CommendationNeo4j Operations Dashboard
Built a comprehensive internal-style dashboard using Next.js, React, TypeScript, and Neo4j. Includes supply-planning module with demand proxies and "what-if" scenario controls.
MSc in Data Analytics & Marketing
Focus: Data handling, Python analytics, and Power BI visualization.
Bachelor of Arts – National Defence Academy
Majors: Economics, Geography, History, and English.
Core Skills
Analytics
Data Technology
Web & Tooling
BI & Visualization
Proficiency Levels
Featured Projects
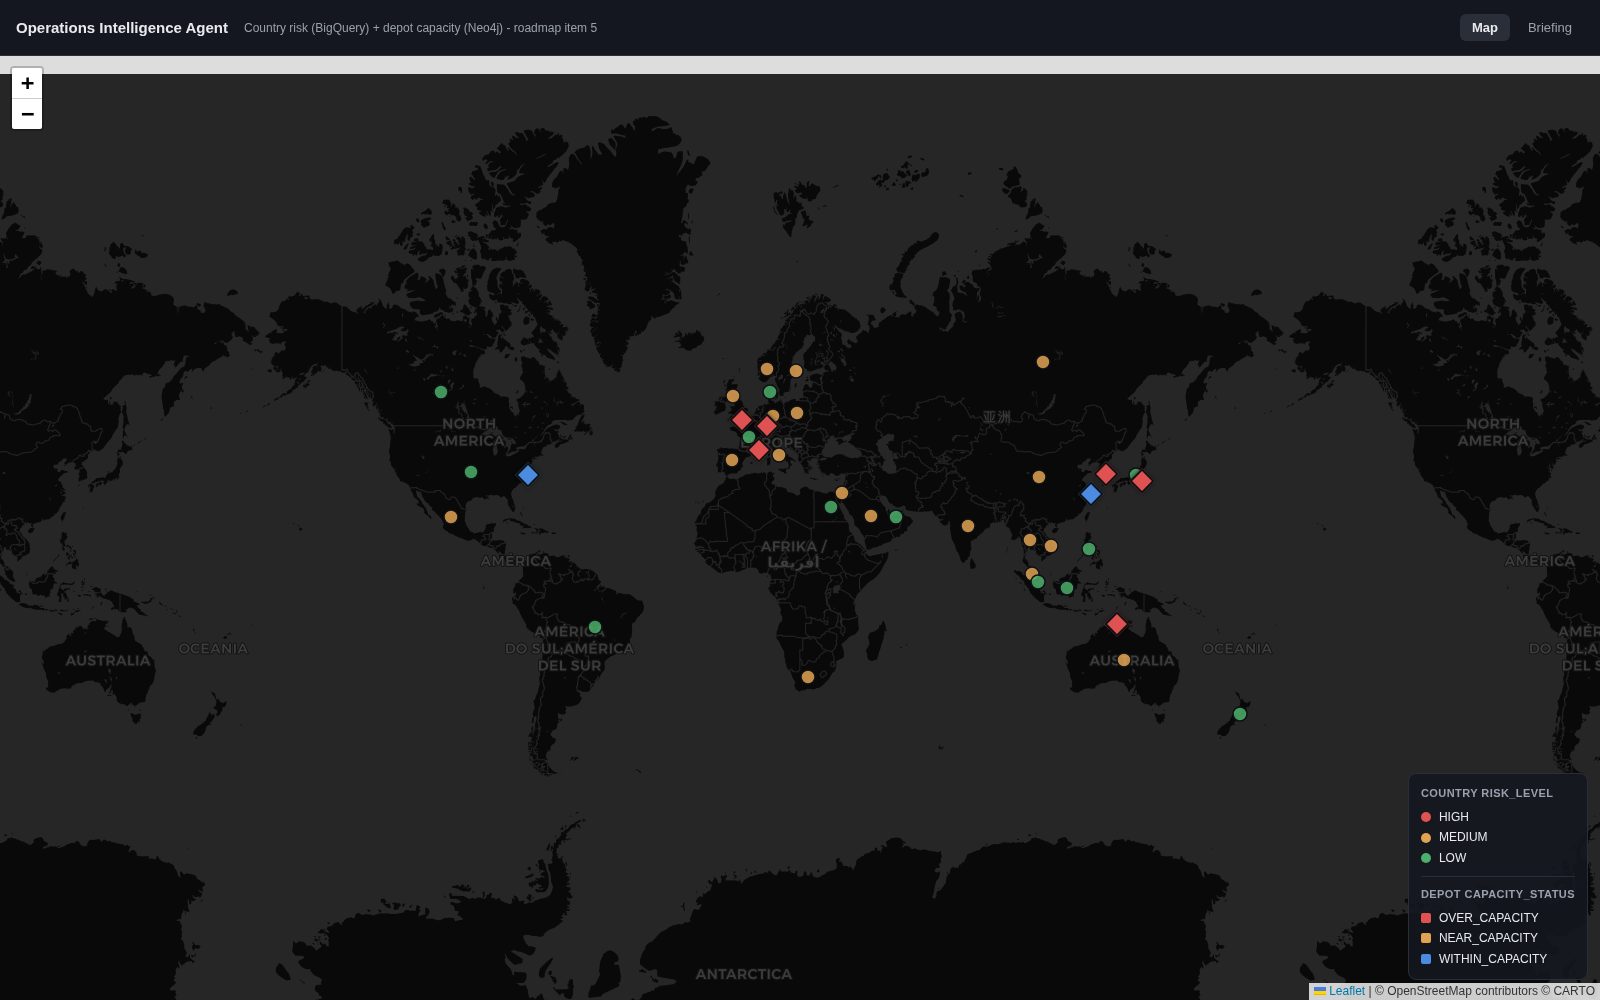
Operations Intelligence Agent
Defense & logistics risk intelligence platform, live on Google Cloud Run. Country-level trade, event, and sentiment data flows through a staged BigQuery pipeline (raw → staging → marts) into a BigQuery ML risk model, joined with a Neo4j depot-capacity graph. On top sits a LangGraph SITREP agent serving a geospatial risk map and a cited briefing API — also installable as an MCP server in Claude Desktop.
🔎 Fully deployed and clickable: interactive world risk map plus a Situation / Assessment / Recommendation briefing agent grounded in queryable marts — not free-form LLM output. Ships with an eval suite and architecture decision records.
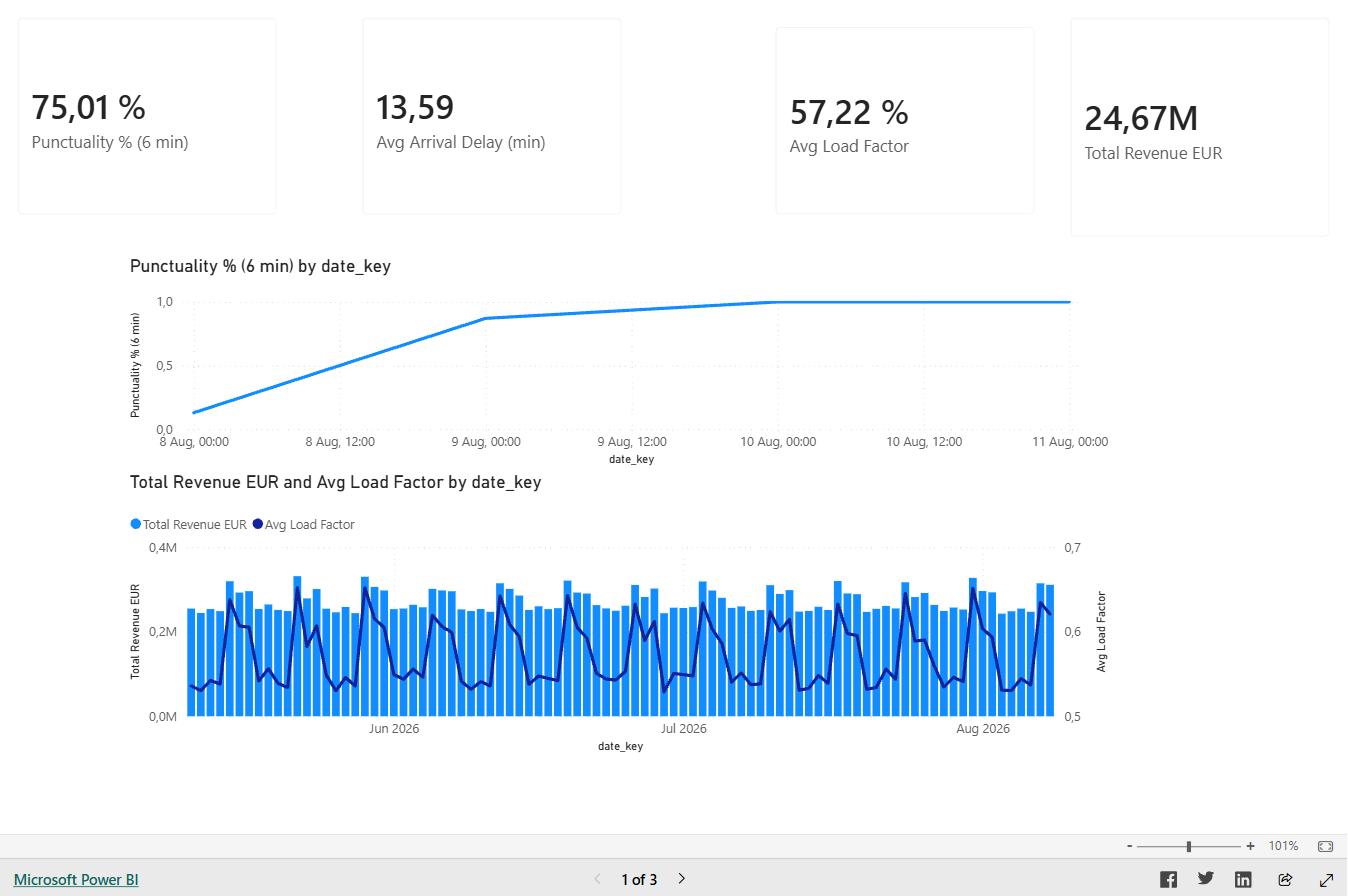
Rail Ops Analytics
End-to-end analytics platform for long-distance rail operations in Germany. A Python pipeline ingests real Deutsche Bahn delay data and FlixTrain’s real route network, models it into a documented BigQuery star schema, and serves a 3-page Power BI dashboard — punctuality, cancellations, station bottlenecks, load factor, revenue per seat-km.
🔎 Found and fixed a silently-broken join during QA — 0 of 3,600 rows ever matched — rather than ship it. Every synthetic figure is labelled end to end; nothing real is faked.
German Grid Balance Intelligence
End-to-end grid analytics platform on real ENTSO-E Transparency Platform and DWD weather data, no synthetic data, for the DE-LU bidding zone, Feb to Aug 2026. A Python ELT pipeline lands data through raw, staging, and marts layers in BigQuery, with a star schema and purpose-built KPI views feeding a live Power BI dashboard on load/generation mismatches, storage response, and cross-border flow.
🔎 Caught two Sum-vs-Average aggregation bugs (one a regression after a rebuild) and a field-source mix-up between visuals during QA, and held every finding to the confidence the data actually supports: a 2-day storage-response pattern is flagged as a hypothesis, not a conclusion.
My Book